The Black Vote
Where Black Voters Live & Breathe
5 quick facts about the geographic dispersion of St. Petersburg’s African American electorate
– By Gypsy C. Gallardo
The following facts will be well-known for some, but surprising to those of us not up-to-speed since City Council districts were redrawn in 2012. The process led to major changes in representation for African Americans.
Here are 5 facts about the geographic concentration and distribution of St. Petersburg’s African American electorate.
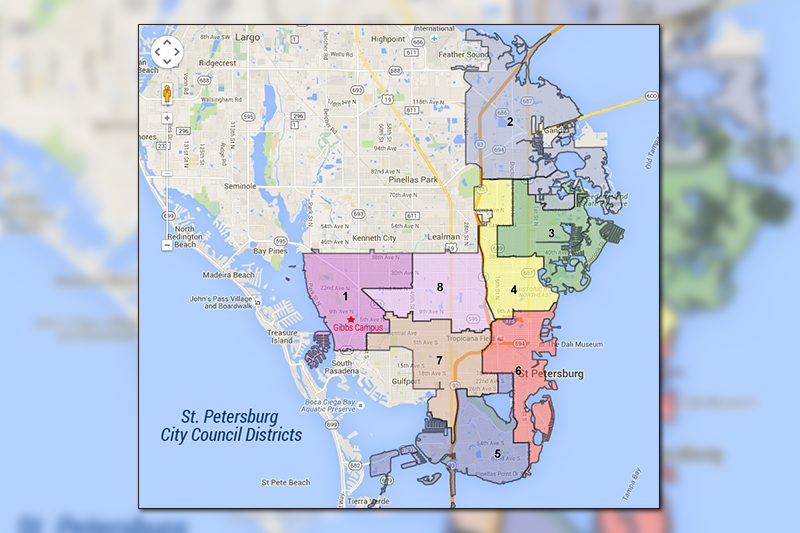
#1 Only one of St. Petersburg’s eight City Council district’s is majority-black
District 7 is currently the only City Council district where African Americans are a majority of voters (64% of persons registered to vote, and 65% of those who actually voted in the 2013 Mayoral contest). Next in line is District 5, followed by District 6.
| % of Actual Voters in 2013 | % of Registered Voters in 2013 | |
| District 1 | 1.4% | 2.5% |
| District 2 | 5.9% | 9.2% |
| District 3 | 1.1% | 1.9% |
| District 4 | 2.3% | 4.0% |
| District 5 | 38.6% | 42.9% |
| District 6 | 29.5% | 37.4% |
| District 7 | 64.7% | 63.6% |
| District 8 | 5.4% | 6.9% |
| 17.7% | 20.9% |
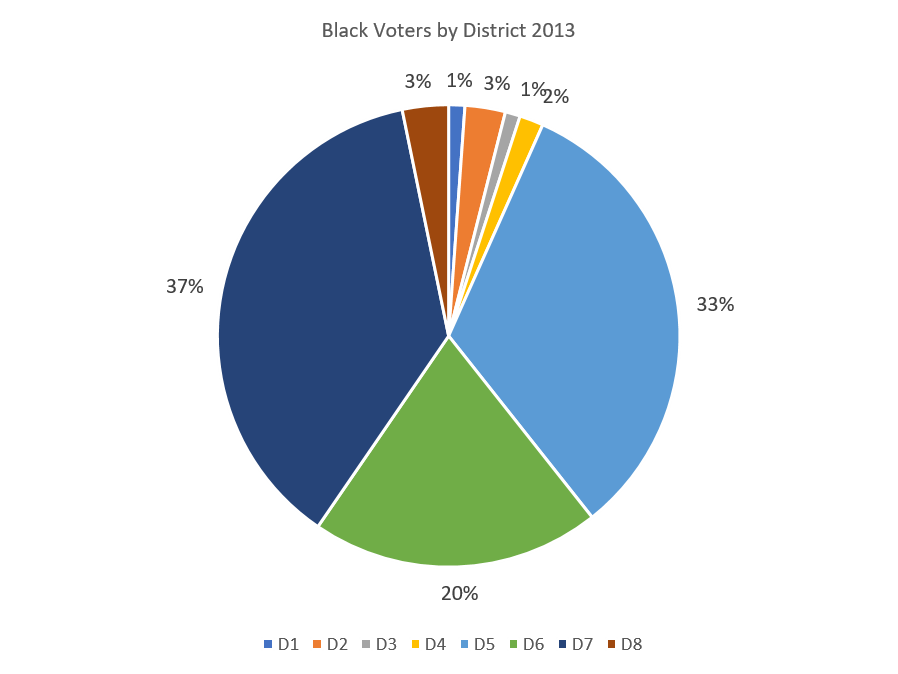
#2 Black voters are overwhelmingly concentrated in Districts 5, 6, and 7
In St. Petersburg’s most recent Mayoral election (2013), a full 90% of black votes came from Districts 5, 6, and 7. [“D” stands for District in the graphic below]
#3 District 7 has the highest black vote count
District 7 (currently represented by City Councilmember Lisa Wheeler-Bowman) has the largest black voting base in the city (over 12,000 strong, in terms of registered voters in 2013).
[* The asterisk symbol in the table below denotes the highest registered voter count, actual vote count and voter turnout rates for African Americans]
| Registered to Vote | Actually Voted in 2013 | Voter Turnout In 2013 | |
| District 1 | 500 | 107 | 21.4% |
| District 2 | 1,573 | 267 | 17.0% |
| District 3 | 409 | 99 | 24.2% |
| District 4 | 784 | 158 | 20.2% |
| District 5 | 8,794 | 3,089 | *35.1% |
| District 6 | 7,189 | 1,912 | 26.6% |
| District 7 | *12,022 | *3,518 | 29.3% |
| District 8 | 1,275 | 305 | 23.9% |
| TOTALS: | 32,546 | 9,455 | 29.1% |
#4 District 5 has the highest black voter turnout rate
Although District 7 has the largest base of African Americans registered to vote, and the largest black vote count in the 2013 election, it is District 5 (currently represented by Councilmember Steve Kornell) that had the highest black voter turnout rate in 2013.
The black turnout rate for Kornell’s district was 35.1% in 2013, compared to 34.2% for white voters citywide. [See table above]
#5 Black voters are less than 10% of the electorate in most City Council districts
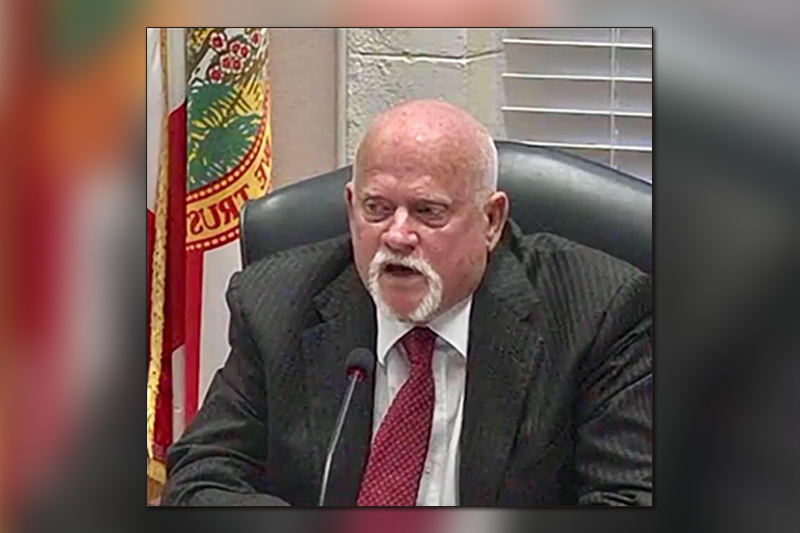
Black voters claim under 10% of the electorate in five of the eight St. Petersburg City Council districts. In District 3, currently represented by City Councilmember Ed Montanari, only 1% of voters were black in the 2013 general election.
Related Posts

Advertise


