The Black Vote
This page brings you the best and latest information about the size and strength of the black vote in St. Petersburg, Florida. Curious about some facet of the black electorate? Ask us about it and we will make every attempt to feed back.
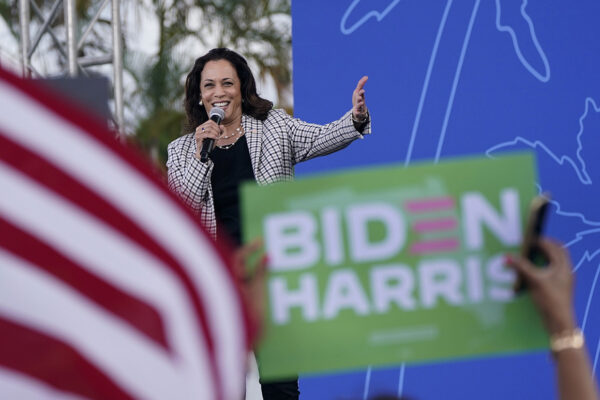
New Poll: Black Floridians on Kamala Harris and Whether Nation is Ready to Elect a Black Woman as President
The results of a snap poll of 100 diverse African American leaders in Florida indicates the 2024 general election may generate epic Black …
4 Reasons Black Leaders Are Ridin’ with Biden, as Many White Dems Call for Him to Go
Joy Reid, the well-known host of MSNBC’s The Reid Out, caused some pearl clutching on both sides of the aisle when she proclaimed on July …
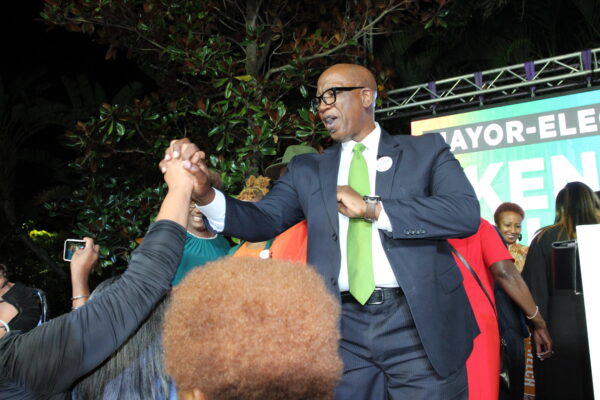
Welch won by widest margin in history; Black voters a vital force in true multicultural victory
Above, Mayor-Elect Ken Welch celebrating his victory Tuesday night (courtesy of The Weekly Challenger) Kenneth T. Welch was elected last …
5 Reasons So Many Black Voters Still Unsure in St. Pete Mayoral Election
Poll results released Friday show three times more Black voters undecided in St. Pete’s mayoral race, compared to the 2017 …
Quick Facts: City Councilmembers with the Most & Fewest Black Voters in Their Districts
St. Petersburg had 36,803 Black registered voters on the rolls by the 2020 General Election; about 25,700 of them cast their ballot in …
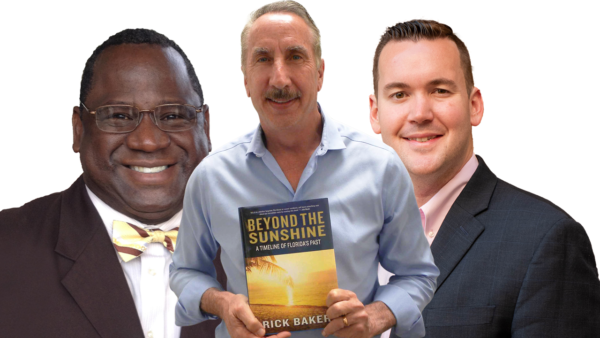
Who is Rick Baker Really Backing for Mayor? His Money Says Blackmon; But Newton Camp Suggests Otherwise
Two weeks out from the August 24th primary election in St. Petersburg, it's still an open question as to which mayoral candidate has the …
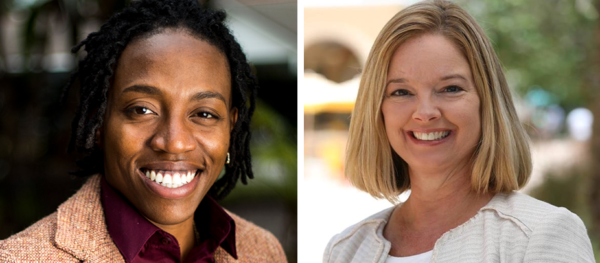
4 Reasons We Need a “Black Agenda” in District 6, Even if We Don’t Elect a Black Person to the Seat
Above, Mhariel Summers (the challenger, left) and Gina Driscoll (the incumbent, right) will face off in the general election that ends …
Some ‘Splaining to do re St. Pete’s Black Vote 2020; 10 Facts that Say Dems Unprepared for the Next Big Election
-By Gypsy C. Gallardo African Americans in Pinellas County turned in their highest vote count ever in the 2020 Presidential Election, …
For the 1st Time, People of Color are a Majority of Florida Democrats
- Gypsy C. Gallardo for the Power Broker Media Group For the first time in presidential election history, a majority of Florida’s …
1st Time Look at Clearwater’s Black Vote; 6 Quick Comparisons to St. Pete
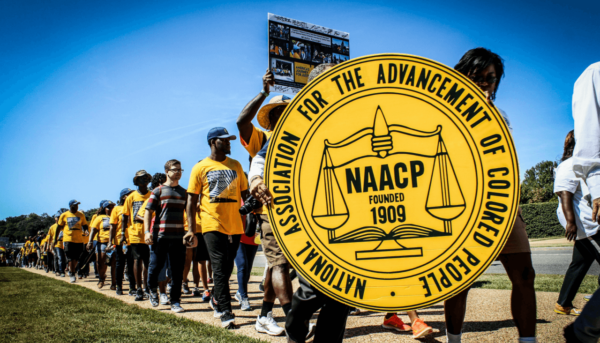
NAACP activists march (Facebook page of Clearwater/Upper Pinellas NAACP, which will be active in voter turnout efforts in Clearwater in the …
Black Vote Counts & Voter Turnout Rates in St. Petersburg 2004 to 2019: City Council, Mayoral, Midterm & Presidential General Elections
Black Votes & Voter Turnout Rates
Mayoral, Midterm & Presidential Elections, 2001 to 2016
| Black Vote as Share of Total Vote – City of St. Petersburg | ||||
| Select elections 2001 to 2016 | ||||
| Election | Total Vote | Black Vote | %Black | Type |
| 2001 Primary | 37,144 | 6,775 | 18.2% | Mayoral |
| 2001 General | 49,702 | 8,883 | 17.9% | Mayoral |
| 2004 Primary | 32,317 | 5,114 | 15.8% | Presidential |
| 2004 General | 117,397 | 21,478 | 18.3% | Presidential |
| 2005 Primary | 4,034 | 1,297 | 32.2% | |
| 2005 General | 32,619 | 7,037 | 21.6% | Mayoral |
| 2008 Primary | 20,695 | 5,003 | 24.2% | Presidential |
| 2008 General | 123,269 | 25,529 | 20.7% | Presidential |
| 2009 Primary | 37,076 | 6,939 | 18.7% | Mayoral |
| 2009 General | 46,678 | 7,041 | 15.1% | Mayoral |
| 2010 Primary | 37,204 | 6,605 | 17.8% | Gubernatorial |
| 2010 General | 78,709 | 14,223 | 18.1% | Gubernatorial |
| 2012 Primary | 35,147 | 6,445 | 18.3% | Presidential |
| 2012 General | 122,835 | 26,152 | 21.3% | Presidential |
| 2013 Primary | 50,589 | 7,411 | 14.6% | Mayoral |
| 2013 General | 53,378 | 9,452 | 17.7% | Mayoral |
| 2014 Primary | 37,510 | 6,882 | 18.3% | Midterm |
| 2014 General | 93,213 | 17,094 | 18.3% | Midterm |
| 2016 Primary | 46,786 | 8,794 | 18.8% | Presidential |
| 2016 General | 132,468 | 24,649 | 18.6% | Presidential |
| Overall average | 1,188,770 | 222,803 | 18.7% | |
| Average per election | 19.2% | |||
