News
1st Time Look at Clearwater’s Black Vote; 6 Quick Comparisons to St. Pete
![]()
NAACP activists march (Facebook page of Clearwater/Upper Pinellas NAACP, which will be active in voter turnout efforts in Clearwater in the months ahead)
– By Gypsy C. Gallardo for Power Broker Media Group
The Power Broker Media Group has chronicled the black vote in St. Petersburg, Florida, for 16 years. This marks our first look at the size and strength of the African American electorate in Clearwater (home to Pinellas County’s second largest black population). Based on a review of the past four presidential general elections, Clearwater’s black vote is gaining strength and consistently turns out in presidential cycles. Though St. Pete’s black voting base is five times larger and typically produces slightly higher turnout rates, Clearwater shows a higher black registration rate and stronger growth in net new African American registrations over the past three presidential cycles.
Here are six things we should know about our north Pinellas peers as we head into the thick of the 2020 contest.
1. African Americans are 7,000 voters strong, 10% of Clearwater electorate
Clearwater has nearly 7,000 registered black voters, which is roughly 10% of the city’s population of registered voter. Americans are currently the largest racial/ethnic minority voting bloc in the city.![]()
This is fast-changing though, as Latinos and other people of color grow their numbers in the city. Among the four racial/ethnic groups tracked by the Pinellas County Supervisor of Elections, Hispanics had the biggest bounce in voter registrations in Clearwater, both in number of new registrations and percentage growth (166%).
Overall, people of color are a growing share of Clearwater’s voter base. Racial and ethnic minorities were 16% of Clearwater’s registered voters in 2004. Their share grew to 23% in 2016.
2. Clearwater’s black vote growing faster 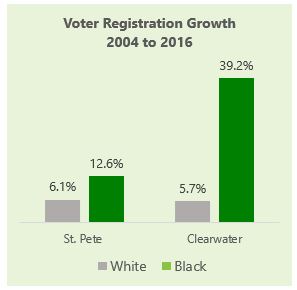
St. Pete had five times more registered African Americans in the 2016 election (34,621), but Clearwater’s black electorate is faster growing, relative to its size.
Between the 2004 and 2016 presidential elections, Clearwater’s black registration count grew 39%, compared to 13% growth for St. Petersburg. In Clearwater black voters added a net new 1,957 registrations to the rolls over the 12-year span, versus 3,876 net new black registrations in St. Petersburg.
Also notice in the graph above that Clearwater’s black voter growth rate is seven times higher than white voter growth in the City for the years studied by Power Broker.
3. Turnout is strong in presidential elections
Clearwater voters outperformed the national average for African American turnout in 2016 (68.5% in Clearwater versus 59.6% nationwide). Turnout rates are lower for African Americans in Clearwater, compared to St. Pete, but only slightly.
![]()
4. The white-black gap is bigger in Clearwater
St. Petersburg’s black voters closed the gap with white voters in the 2008 election (President Obama’s first run) and reversed the gap in 2012, besting white voter turnout by a percentage point. The white-black gap is larger in Clearwater, modestly. Clearwater’s black voters almost closed the gap with white voters in 2008 and 2012 but had 10% lower turnout than whites in 2004 and 2016.
![]()
5. Black turnout dropped by more in Clearwater in 2016
In the 2016 presidential (Hillary Clinton vs Donald Trump), turnout dropped a bigger degree for Clearwater’s black voters. Voter turnout was down 3.9% for African Americans in St. Pete, compared to a 5.0% decline for Clearwater’s black voters and a 7% decline for African Americans nationwide.
6. More African Americans are registered in Clearwater, St. Pete lagging in new registrations
Clearwater has consistently higher registration rates for African Americans, compared to St. Pete (i.e., the percentage of adults who are registered). The registration rate declined for both cities over the last two election cycles (possibly due to Governor Rick Scott’s reversal of ex-felon voting rights restoration set in place by his predecessor, former Governor Charlie Crist).
Notice in this next graph that St. Petersburg has lost steam considerably in its registration rate since 2008, when 90% of adults 18+ were registered. In 2016, the figure stood at only 78%.
![]()
For information on how you can help with voter education, registration and activation, reach the Clearwater/Upper Pinellas Branch of the NAACP at (727) 307-4865 or NAACP5096@gmail.com.


